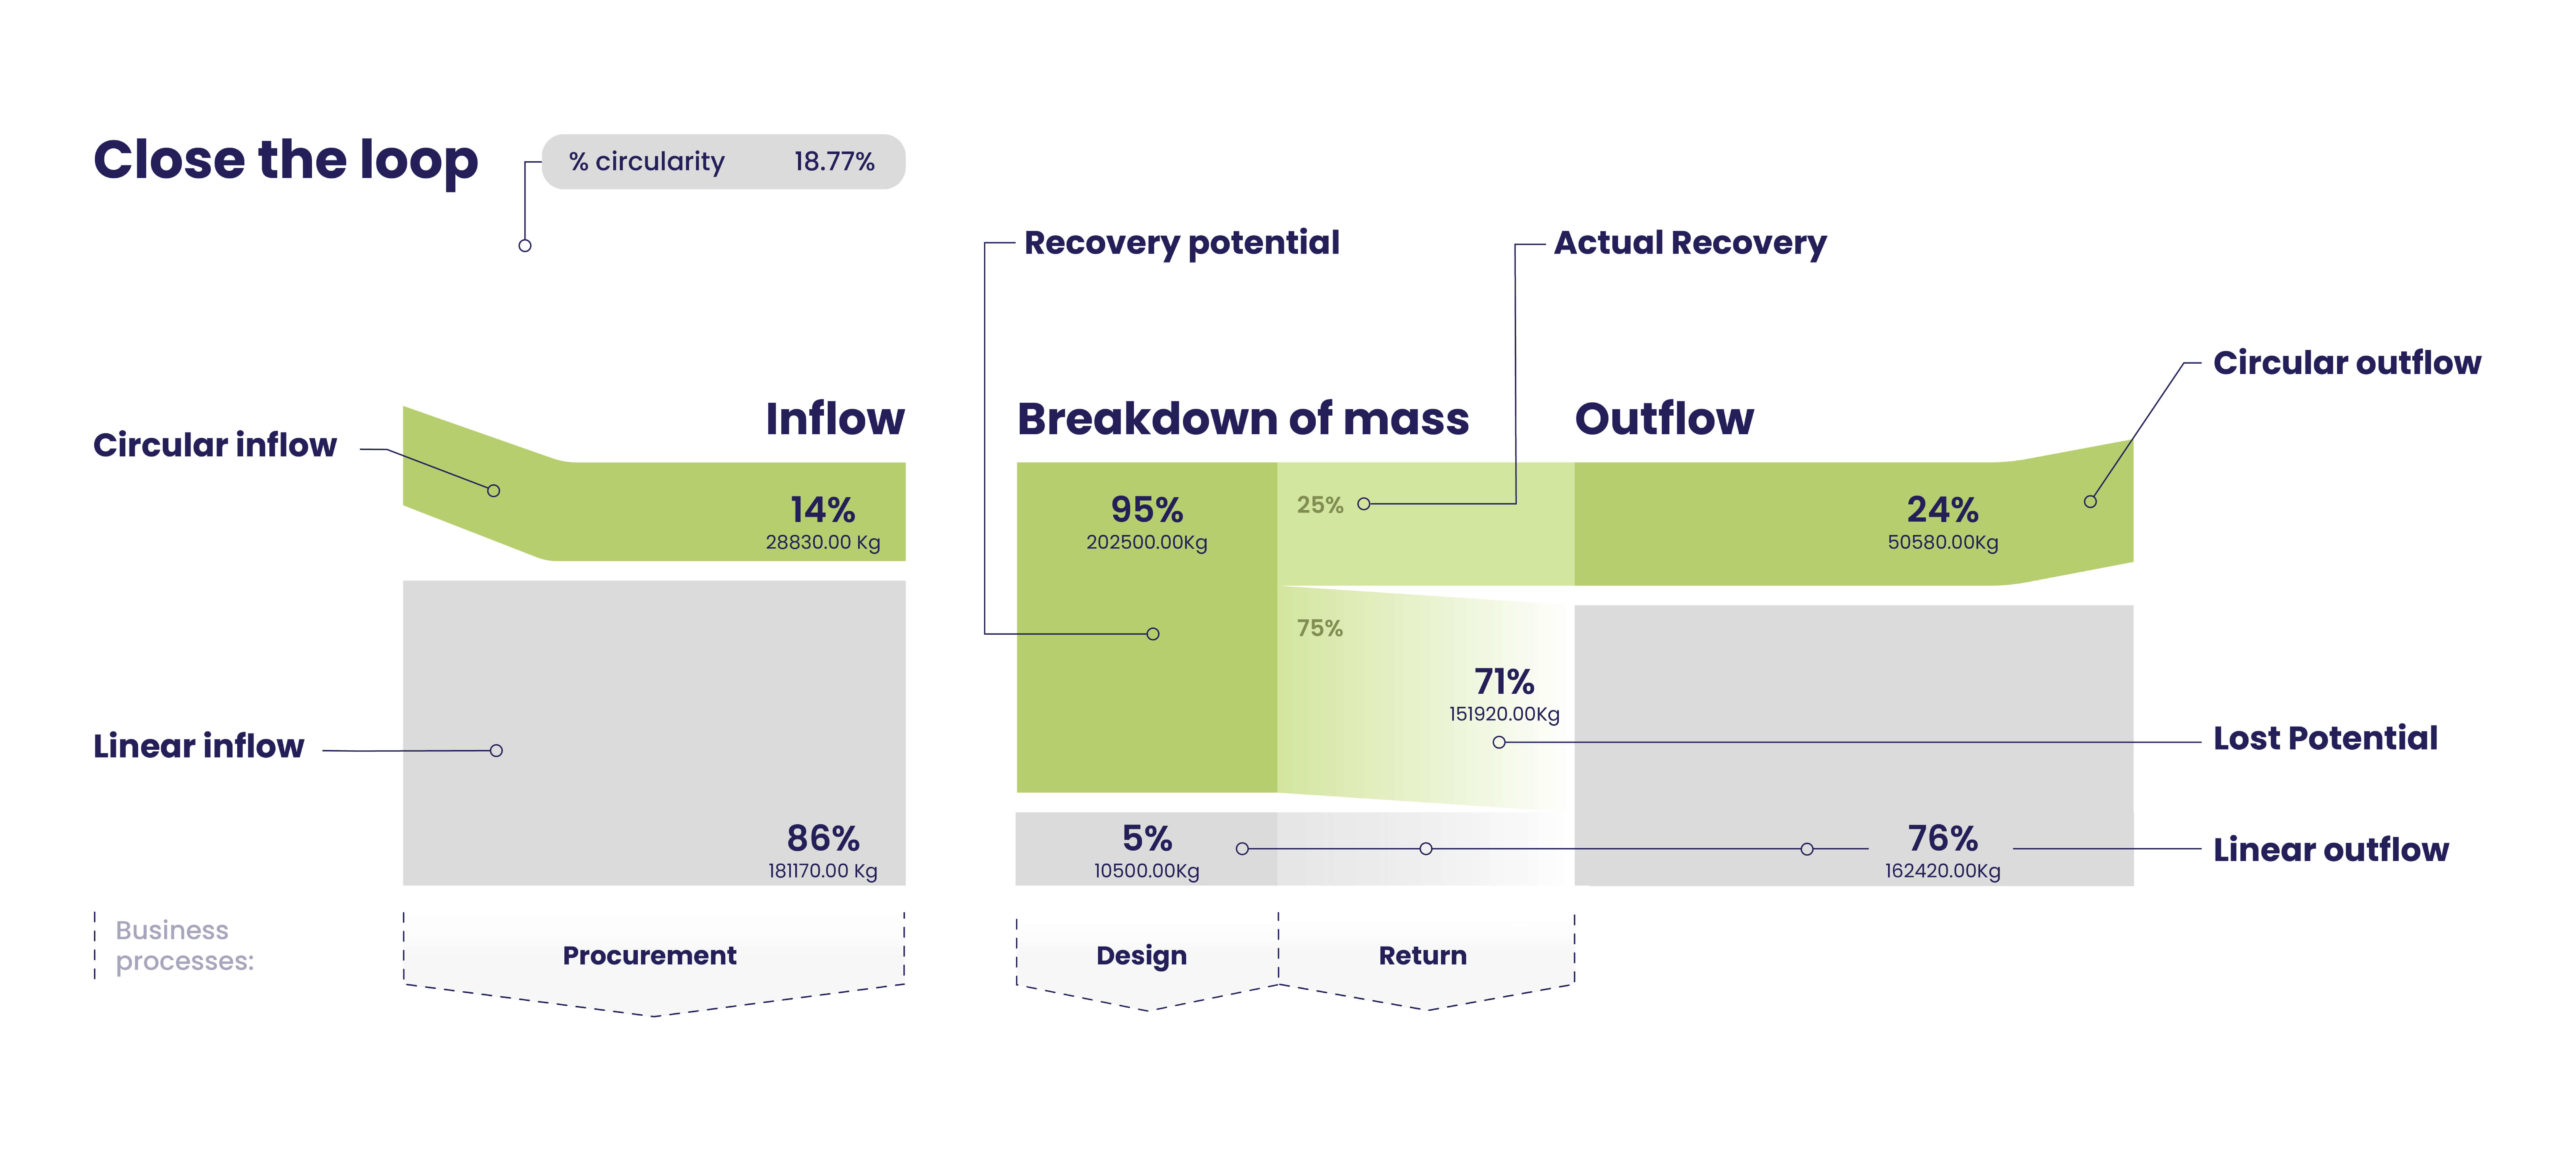
How to start with and understand your circularity  assessment with CTI Tool

1. Circular economy according to CTI: How to read your results?

A self-assessment determining a company’s circular performance is at the center of CTI. It focuses on the circular and linear mass that flows through the company, in which design, procurement and recovery are crucial to determine how well a company performs. In addition to the ability to close the loop, CTI provides insights into how to best optimize resources and the connection between circular material flows and business performance. For detailed information, we recommend that you read the CTI document, available for download here.

See an explanatory diagram ↴

% Circularity
The weighted average of the % circular inflow and % circular outflow for a given product (group or portfolio), business unit or company.

Circular inflow
Inflow that is:
• Renewable inflow* (see definition below) and used at a rate in line with natural cycles of renewability
OR
• Non-virgin

Linear inflow
Virgin, non-renewable resources

Recovery potential
How does the company design its products to ensure the technical recovery of components and materials at a functional equivalence (e.g., by designing for disassembly, repairability, recyclability, etc.) or that they are biodegradable?

Actual Recovery
How much of the outflow does the company actually recover?
The outflow includes products, by-products and waste streams. Companies can improve actual recovery rates through closed loop business models or mandatory or voluntary open loop recovery scheme efforts.
The results will illustrate how effectively

Circular outflow
Outflow that is:
• Designed and treated in a manner that ensures products and materials have a full recovery potential and extend their economic lifetime after their technical lifetime
AND
• Demonstrably recovered.

Lost Potential

Outflow that has a potential to be recovered but is neither demonstrably recovered nor flowing back into the economy.

• Replace current linear inflow with non-virgin alternatives
• Replace current linear inflow with renewable alternatives
• Replace non-renewable bio-based resources with renewable alternatives (for example through certification for sustainably managed bio-based resources)
• Reduce resource use through light-weighting of products
• Reduce resource use through use optimization, digitalization, replacing physical products with services (called “servitization” in some sectors), durability, etc.
• Reduce resource use through optimize nutrient consumption (i.e., avoiding food waste and replacing nutrients/protein with less resource-intensive alternatives)

•Redesign to incorporate, among others, modular design, design for disassembly, high recyclability by using mono-materials (technical cycle) and/or biodegradability and non-toxicity (biological cycle)

•Increase actual recovery by selling a product as a service or instituting pay per use (technical cycle)
•Increase actual recovery through buy-back/take-back schemes (technical cycle)
•Increase the actual recovery through value chain collaboration and partnerships for collection and recovery programs
•Increase biodegradable outflow that is actually consumed
(i.e., by avoiding food waste or high valorization) (biological cycle)

Linear outflow
Outflow that is not classifiable as circular. This means that the outflow:
• Is not circular in design/consists of materials treated in a manner that they have no recovery potential
OR
• Neither demonstrably recovered nor flowing back into the economy.

Linear outflow
Outflow that is not classifiable as circular. This means that the outflow:
• Is not circular in design/consists of materials treated in a manner that they have no recovery potential
OR
• Neither demonstrably recovered nor flowing back into the economy.

Linear outflow
Outflow that is not classifiable as circular. This means that the outflow:
• Is not circular in design/consists of materials treated in a manner that they have no recovery potential
OR
• Neither demonstrably recovered nor flowing back into the economy.

*Renewable inflow- Sustainably managed resources, most often demonstrated by internationally recognized certification schemes like the Forest Stewardship Council (FSC), Programme for the Endorsement of Forest Certification (PEFC), Roundtable on Sustainable Palm Oil (RSPO), etc.23 that, after extraction, return to their previous stock levels by natural growth or replenishment processes at a rate in line with use cycles. Therefore, they are replenished/regrown at a faster rate than harvested/extracted.

2. Not sure where to start with your assessment?

Starting with your circularity assessment can feel overwhelming at first. Thanks to our experience and invaluable feedback from our partners and customers, we created a decision tree to guide you on your first steps. The diagram below clarifies how the decision tree helps you get started.

Use the decision tree ↴

3. Which indicators should you select?

Any company, regardless of size, sector or position in the value chain, can use the CTI framework, but the selection of indicators suitable for each business will vary. Once you understand your objectives, CTI offers a menu of indicators that enables you to answer the questions from the scoping step.

Select CTI indicators at CTI Tool ↴

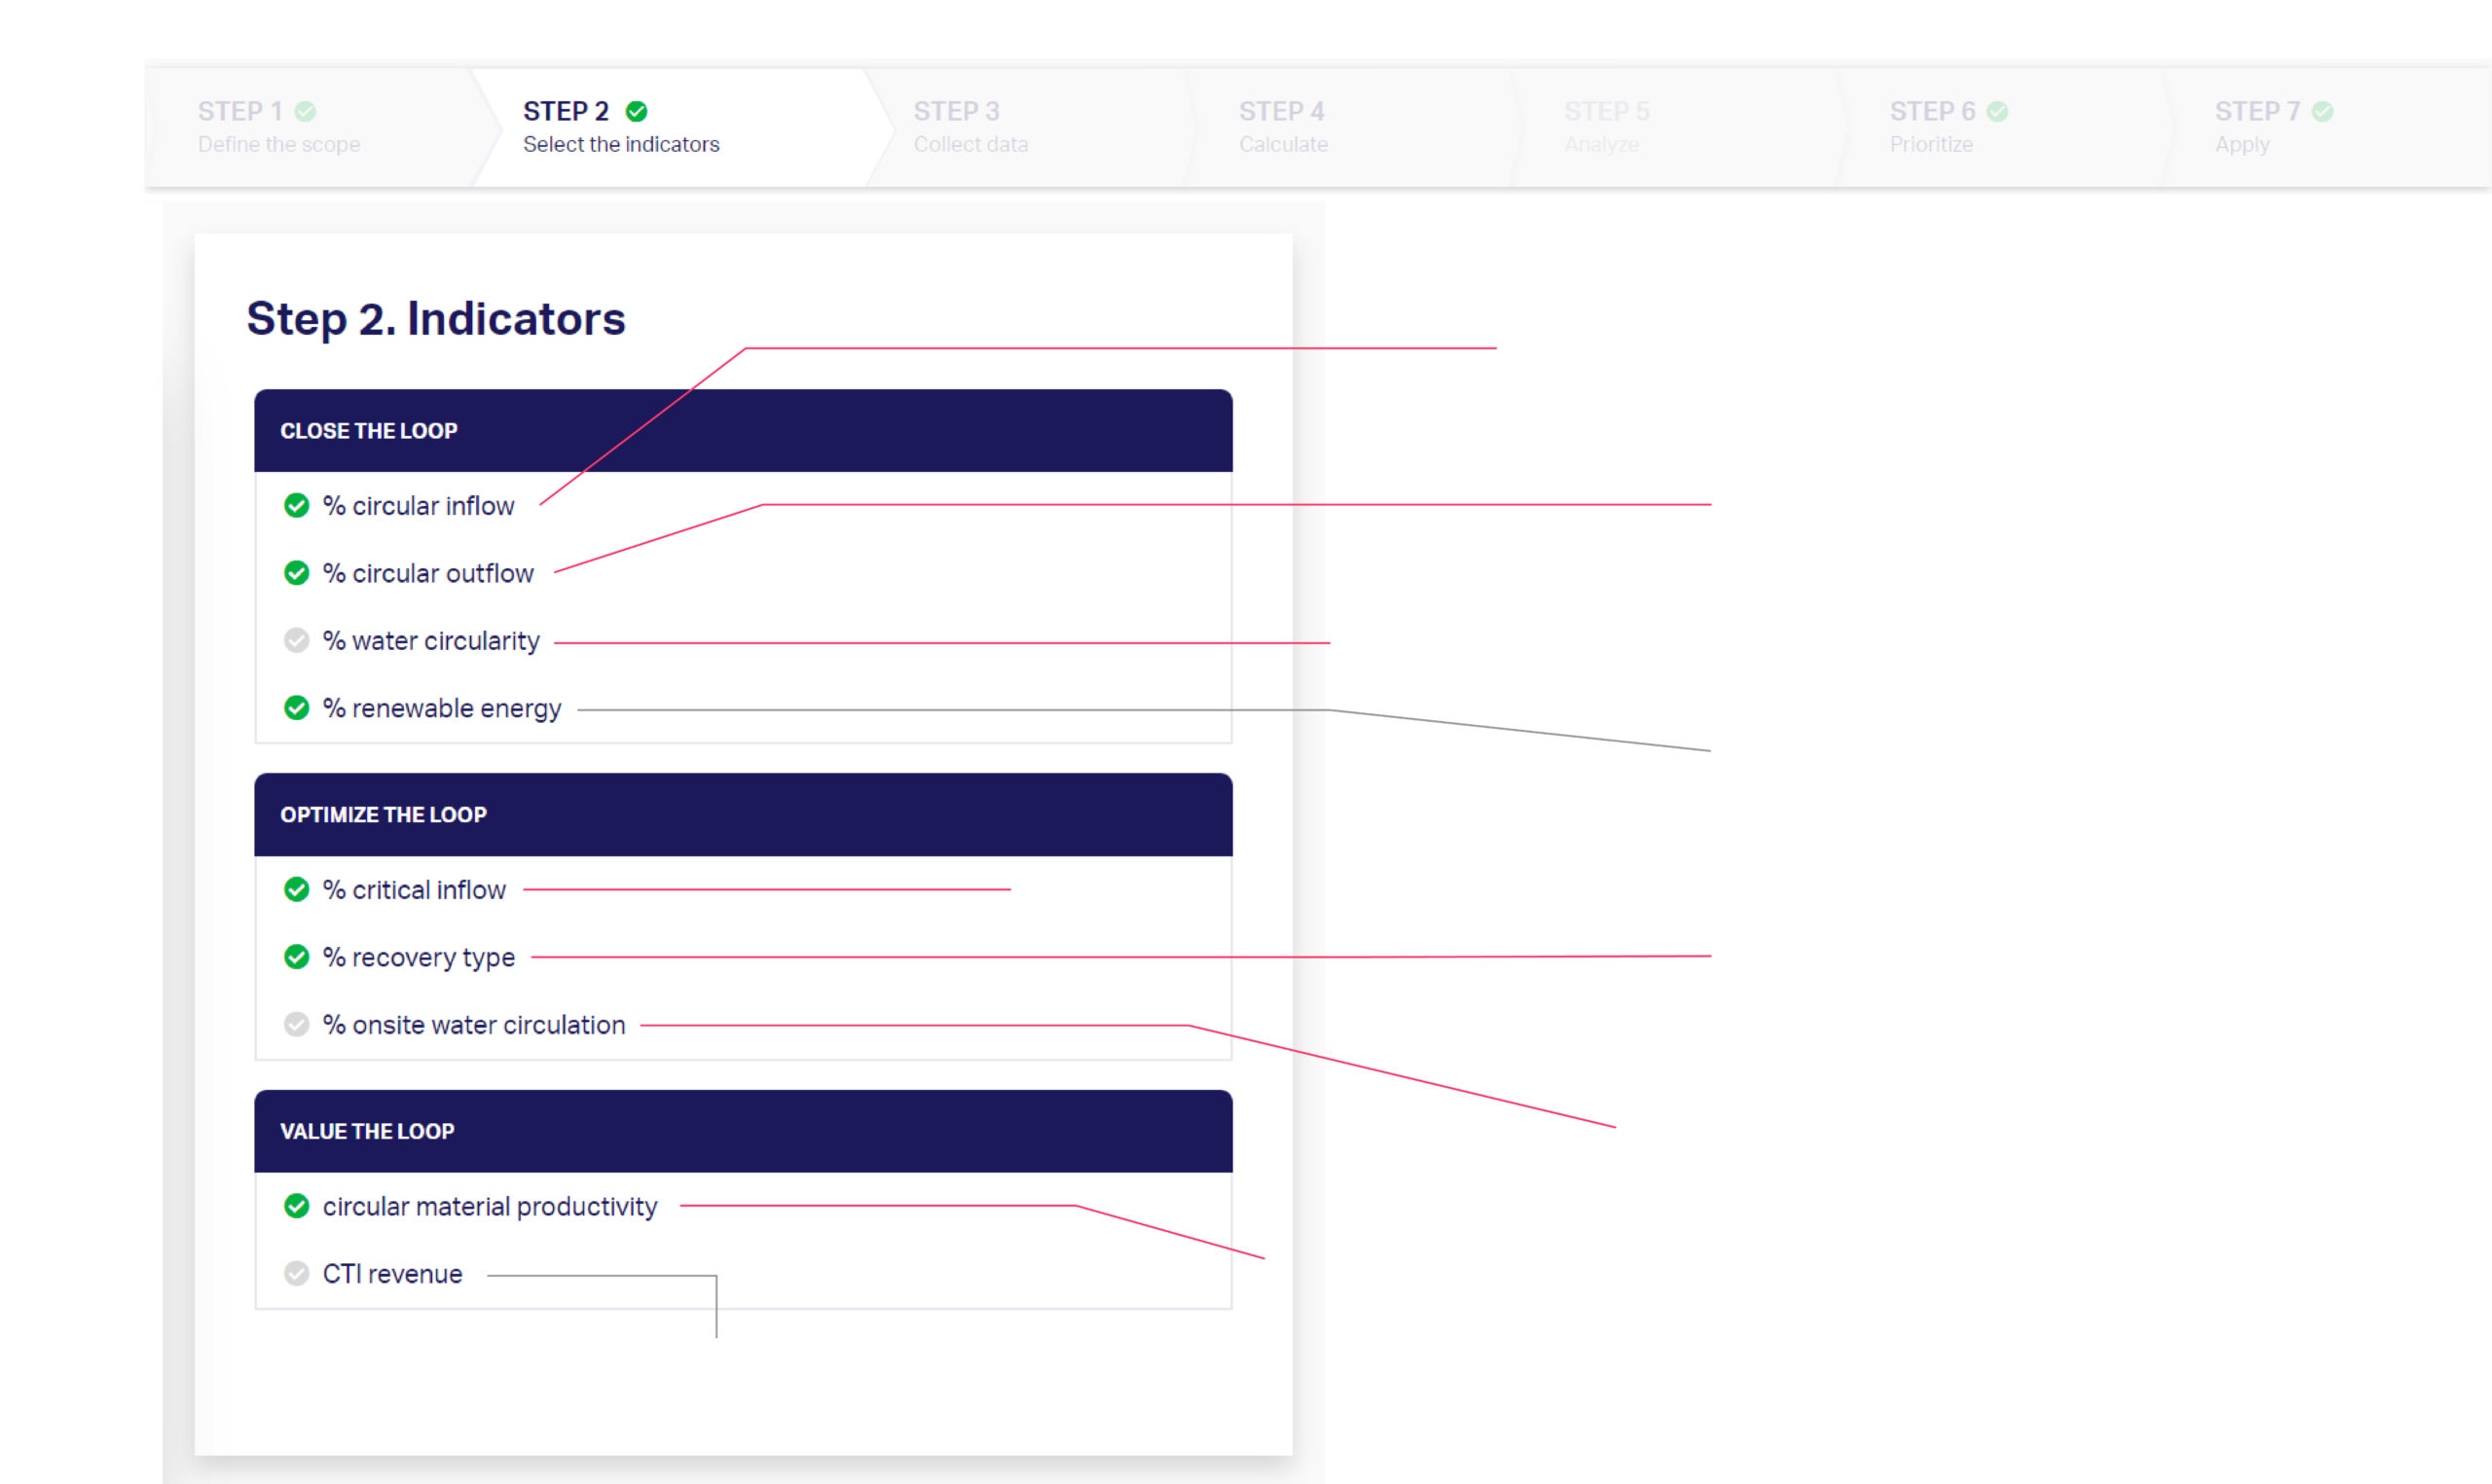
Enables more recycled content

Enables greater recoverability

Enables onsite water purification

Transparency on renewable energy use

Solution substitutes for critical materials

Enables greater recovers of products

Increases use of each drop of water

Enables less resource consumption or greater utilization

Proposal: out of scope for indicator

4. Always feel free to contact us

Our team consists of experienced and knowledgeable people working in the field of Circular Economy. Roy Vercoulen is always here to help you move through every step of your assessment.

Roy Vercoulen

Founder & CEO

CTI Tool
CTI Tool