CTI Report
Only 11% of the businesses that have emissions targets are hitting their reduction goals.
Knowing what’s driving your emissions and where to focus your efforts is key. This is where materials play a crucial role.
The CTI Report shows your company a clear path forward to improve its material impact and over deliver on the sustainability targets that have been set.
Clarity on your current circular performance
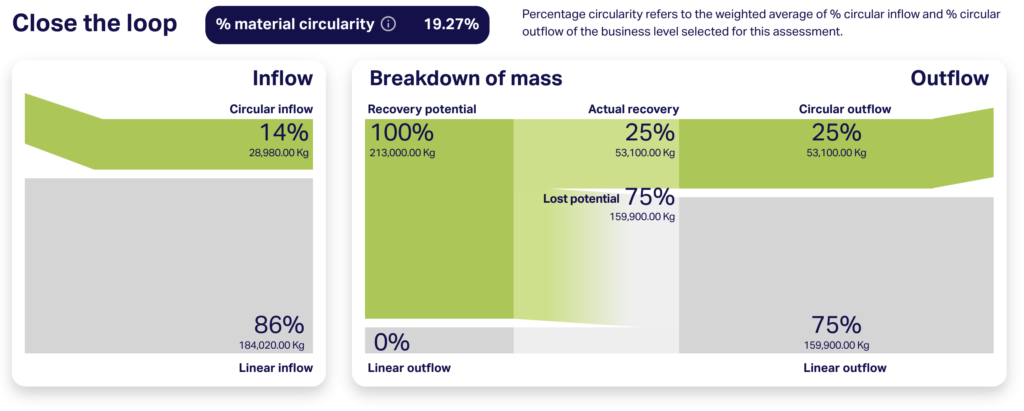
This is the number one indicator most c-level executives are looking for. The percentage material circularity combines your inflow and outflow circularity, and communicates to what extent you are already “closing the loop”.
With minimum input, it shows your circular baseline and allows different stakeholders to get a first overview of the current circular performance. As you continue on your sustainability journey this will help you track your progress.
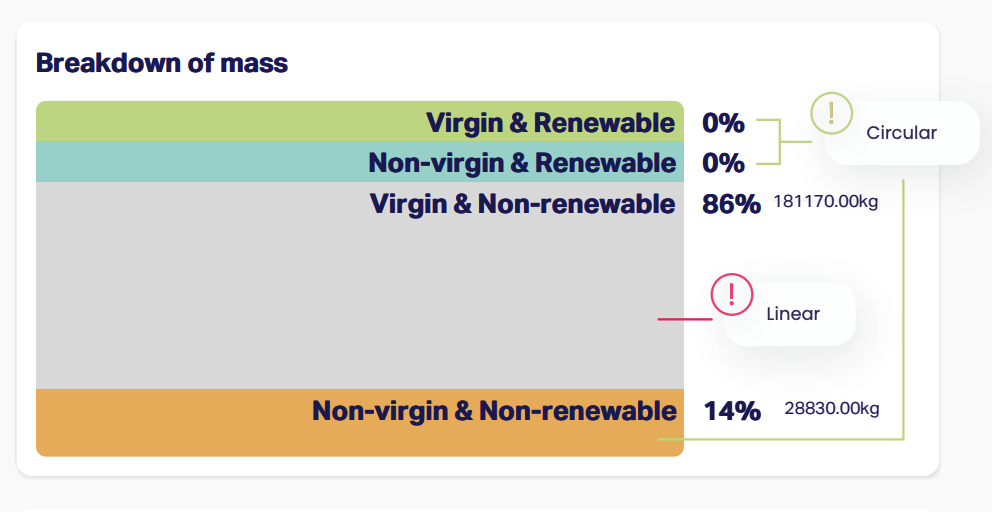
What inflows are driving your performance?
Circular inflow shows the percentage of virgin- and non-renewable materials you are using. The first step to improve your circular performance starts here. The report reveals the biggest offenders of linear material inflows.
What needs to change for a better performance?
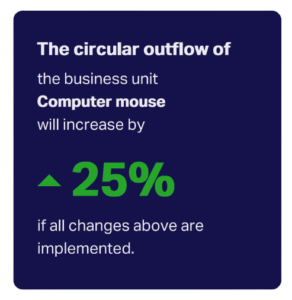
Find out what has the biggest impact on your circularity score and ensure that the actions you take have a direct, measurable impact! By adjusting the levers of your circular inflows and outflows you will gain insights into which parts of your value chain require action.
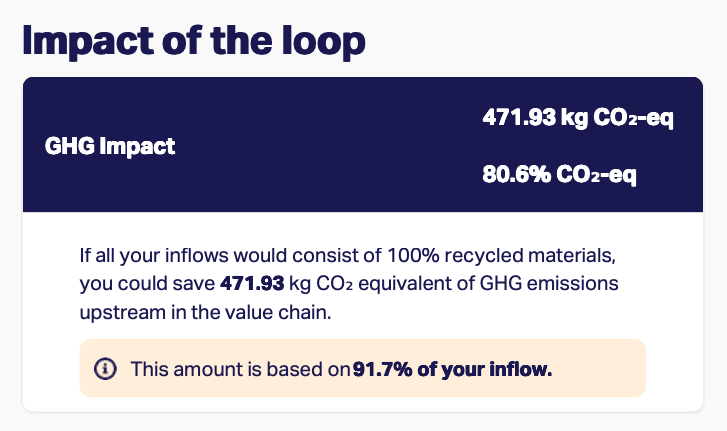
Quantify the impact of your circular strategies on the GHG emissions
The CTI Tool offers high-level indication of the GHG savings they can obtain by applying circular strategies. This information can be used to better understand carbon footprint benefits, evaluate trade-offs and help prioritize circular improvements.
Feel free to contact us
Our team consists of experienced and knowledgeable people working in the field of Circular Economy. We are always here to help you move through every step of your assessment.

